Age verification is now legally required across half the United States, the entire EU under the Digital Services Act, the UK under the Online Safety Act, and Australia for social media platforms. Compliance isn’t optional. But here’s the problem nobody in the compliance conversation wants to talk about: most age verification flows bleed users.
Industry data paints a stark picture. Document-upload verification — the most common method — sees abandonment rates between 30% and 70% depending on implementation. That’s not a rounding error. For a platform processing 100,000 signups per month, a 50% drop-off at verification means 50,000 potential users who wanted to use your product and couldn’t — or wouldn’t — complete the process.
The regulatory mandate is clear. The business question is whether you can satisfy it without crippling growth.
The Anatomy of Verification Drop-Off
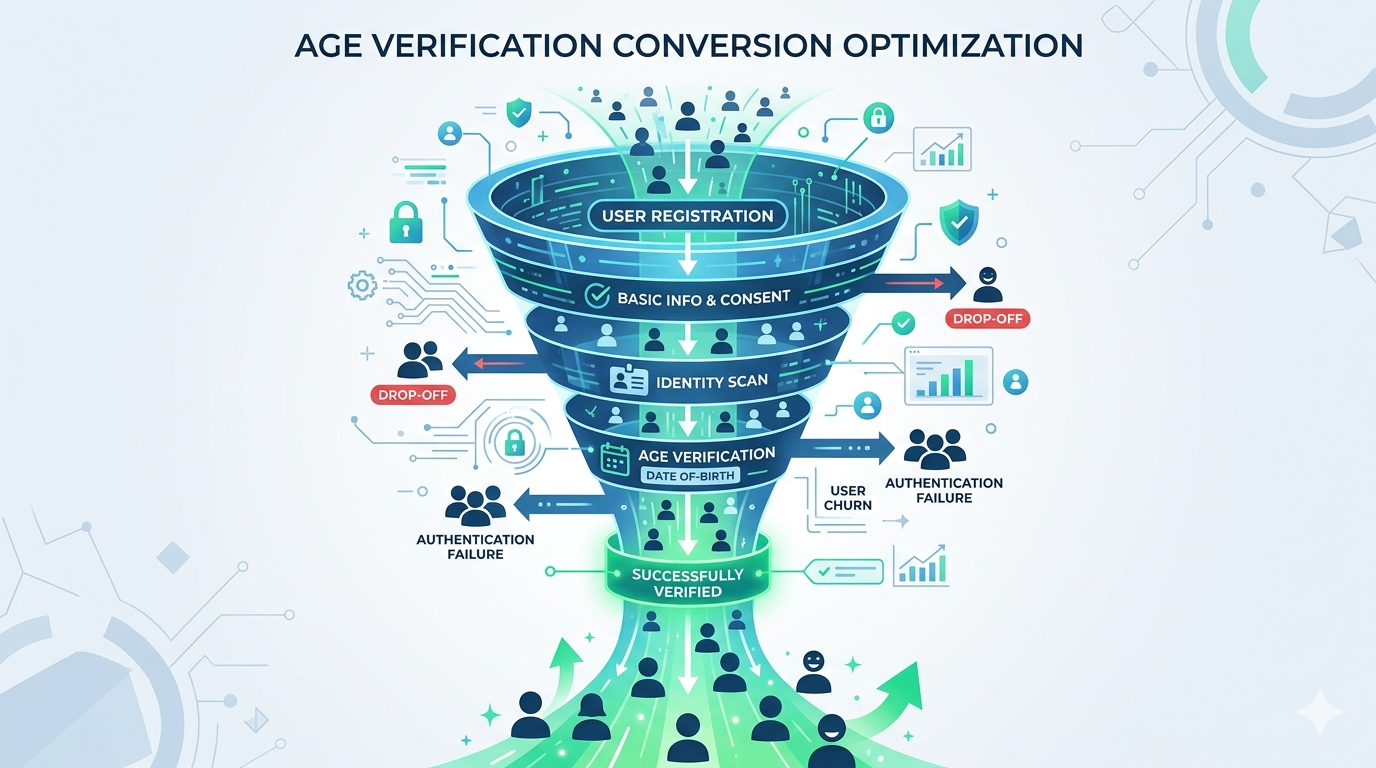
Understanding why users abandon requires looking at the verification funnel the same way you’d analyze any conversion funnel: step by step, measuring where the exits happen and why.
Where Users Leave
Age verification flows typically have three to five discrete steps depending on the method. Each step is a potential exit point:
Step 1: Consent and instructions. The user is told they need to verify their age. Drop-off here is about 8–15% and correlates with how the requirement is framed. Platforms that present verification as a security feature (“We verify age to keep this community safe”) retain better than those that present it as a bureaucratic hurdle (“Due to legal requirements, you must verify your age”).
Step 2: Method selection or initiation. If the user must choose a verification method — upload ID, take a selfie, connect a digital wallet — decision paralysis kicks in. Offering more than three options increases abandonment by roughly 12% compared to a single default path with a fallback.
Step 3: Data capture. This is where the heaviest losses occur. For document upload, users must find their ID, photograph it clearly, and upload it. For selfie-based age estimation, they must grant camera access and take a usable photo. For digital wallet or mDL flows, they need a compatible device and credential. Drop-off at this step ranges from 15% to 45% depending on the method and implementation quality.
Step 4: Processing and result. If processing takes more than 10 seconds, each additional second costs roughly 3% of remaining users. If the result is a rejection or a request to retry, 60–80% of users who fail on the first attempt never come back.
Step 5: Account creation or access grant. Minimal drop-off here — users who’ve completed verification are highly committed. But if there’s an additional registration step after verification, you’ll lose another 5–10%.
The Hidden Cost: Users Who Never Start
The numbers above only count users who initiate the verification flow. They don’t capture the users who see the verification requirement and bounce before even starting. This “shadow drop-off” is harder to measure but often larger than the in-flow abandonment. Analytics from platforms that A/B tested verification placement show that moving age verification from pre-registration to post-first-value-moment reduces shadow drop-off by 20–35%.
Completion Rates by Verification Method
Not all verification methods are created equal. The method you choose — or are required to use — has a dramatic impact on how many users complete the process.
Document Upload (ID + Selfie)
Typical completion rate: 35–65%
The traditional approach: user photographs their government ID, then takes a selfie for face matching. It’s widely accepted by regulators and provides strong identity assurance, but it’s the highest-friction method available.
The failure modes are predictable. Poor image quality accounts for 30% of failures — users photograph their ID on a dark table, with glare, or partially cropped. Selfie capture fails another 15% of the time due to lighting, angles, or users covering parts of their face. And the psychological barrier is significant: handing over a photo of your driver’s license to access a website feels disproportionate to many users, especially for low-stakes content.
When it makes sense: High-stakes verification where regulatory requirements demand document-level assurance — financial services, age-restricted e-commerce, gambling operators under KYC mandates.
AI-Powered Age Estimation (Selfie Only)
Typical completion rate: 75–90%
The user takes a single selfie. An age estimation model — ideally running on-device — analyzes facial features to determine whether the user meets the age threshold. No document required.
This method has the strongest conversion profile for a reason: it requires exactly one action (take a photo), completes in seconds, and doesn’t ask users to produce a physical document. The primary failure mode is camera permission denial (8–12% of users on mobile Safari) and poor selfie quality (5–8%).
The accuracy concern is real but increasingly addressed. Modern age estimation models operating at Challenge-25 thresholds achieve false positive rates below 0.1% while maintaining false negative rates under 3% for users over 25. The trade-off is that users in the 18–24 bracket may need escalation to a secondary method — but this affects a minority of your user base, not the majority.
When it makes sense: Any platform where the regulatory framework accepts age estimation — which now includes the UK (Ofcom’s “highly effective” standard), Australia (eSafety’s technology trial framework), and most US state age verification laws.
Mobile Driver’s License (mDL) and Digital Wallets
Typical completion rate: 85–95% (among users with compatible credentials)
The user taps a button, their device presents a selective disclosure prompt from their digital wallet, they authorize sharing their over-18 status, and verification is complete. No photos, no documents, no uploads.
The catch is eligibility. As of April 2026, approximately 35% of US adults have an mDL-compatible credential, and EU Digital Identity Wallets won’t reach full deployment until late 2026. So while the completion rate among eligible users is excellent, the addressable population is still limited.
When it makes sense: As a preferred fast-path option alongside fallback methods. Offer mDL first for users whose devices support it, then fall back to age estimation or document verification for others.
Device-Level Age Signals (Apple/Google OS APIs)
Typical completion rate: 90–97%
Apple’s Declared Age Range API and Google’s Play Age Signals let platforms receive an age bracket signal from the operating system without any user interaction at verification time. The user verified their age once at the OS level; your platform just reads the signal.
The limitation is coverage. These APIs are new, not universally available, and provide age ranges rather than precise thresholds. They’re also only available for apps distributed through official app stores — web-based platforms can’t use them.
When it makes sense: Mobile apps distributed through Apple App Store or Google Play, as a zero-friction first check with escalation for users without OS-level age data.
Reusable Age Tokens
Typical completion rate: 88–96% (on return visits)
The user verifies once through any method. Your platform issues a cryptographic age token — tied to the device or a passkey, not to personal data — that proves the user’s age status on subsequent visits without re-verification.
This doesn’t solve the initial verification drop-off, but it eliminates it entirely for returning users. Given that returning users typically represent 60–80% of a platform’s active base, the aggregate impact on verification-related friction is massive.
When it makes sense: Every platform should implement reusable tokens. The FTC’s February 2026 COPPA policy statement explicitly supports token-based returning user verification as a privacy-preserving best practice.
The Progressive Assurance Framework
The single most effective architecture for maximizing completion rates while maintaining regulatory compliance is progressive assurance — starting with the lowest-friction method that provides acceptable confidence, then escalating only when needed.
How It Works
Instead of forcing every user through the same verification path, progressive assurance creates a decision tree:
Tier 1 — Zero friction. Check for existing age signals: OS-level APIs, reusable tokens from prior verification, or age data from a connected digital wallet. If a signal exists and meets the required confidence threshold, the user passes without any active verification step. Typical coverage: 15–40% of users (growing as digital wallets and OS APIs mature).
Tier 2 — Low friction. For users without existing signals, present age estimation via selfie. On-device processing completes in under 3 seconds. If the model’s confidence exceeds the regulatory threshold (typically 97%+ for the relevant age bracket), the user passes. Typical coverage: 50–70% of remaining users.
Tier 3 — Medium friction. Users where age estimation confidence is insufficient — typically those in the 16–24 age range — are escalated to document verification or mDL. This group is small (usually 10–20% of your total user base) and often young enough that the request feels proportionate rather than invasive.
Tier 4 — High friction. Edge cases requiring manual review or additional verification steps. This should represent less than 2% of your total user base.
The Math
Assume 100,000 users enter your verification flow:
With a single-method approach (document upload at 50% completion): 50,000 verified users.
With progressive assurance:
- Tier 1: 25,000 users pass with zero friction (100% completion) = 25,000
- Tier 2: 52,500 remaining users attempt age estimation (85% completion) = 44,625
- Tier 3: 7,875 remaining users attempt document verification (55% completion) = 4,331
- Tier 4: 3,544 remaining users enter manual review (40% completion) = 1,418
Total verified: 75,374 users — a 51% improvement over single-method verification.
The regulatory surface is actually smaller too. Because most users verify through low-data methods (age estimation, tokens), the volume of sensitive data your platform processes drops dramatically compared to a document-upload-for-everyone approach.
Seven Engineering Decisions That Move the Needle
Beyond choosing the right verification method, implementation details make or break completion rates. Here are the engineering decisions with the largest measured impact on conversion.
1. Process on Device, Not in the Cloud
On-device age estimation via WebAssembly or native SDKs eliminates the network round-trip that adds 2–8 seconds to cloud-based processing. It also eliminates the privacy concern that causes many users to hesitate — if the selfie never leaves their device, there’s nothing to worry about.
Measured impact: On-device processing improves completion rates by 12–18% compared to cloud-based processing for the same verification method.
2. Pre-warm the Camera
Don’t wait until the user taps “Start Verification” to request camera permissions. Request permission during the consent/instruction screen, so the camera is ready when the user proceeds. On iOS Safari, this eliminates the permission dialog interruption that causes 8–12% of users to abandon.
Measured impact: Camera pre-warming reduces Step 3 drop-off by 6–10%.
3. Provide Real-Time Guidance
If the user’s selfie or document photo isn’t usable, tell them immediately — don’t let them submit a bad image and wait 10 seconds for a failure response. Real-time overlays (“Move into the light,” “Hold your ID flat,” “Remove your sunglasses”) catch quality issues before submission.
Measured impact: Real-time guidance reduces retry rates by 40–60%, and each avoided retry saves 15–25% of users who would otherwise abandon on failure.
4. Set a 10-Second Processing Ceiling
Every second of processing time after 10 seconds costs approximately 3% of remaining users. If your verification pipeline can’t return a result in 10 seconds for 95%+ of attempts, your architecture needs rethinking — not your UI.
Measured impact: Reducing p95 processing time from 15 seconds to 5 seconds improves completion by 8–12%.
5. Design the Failure Path
Most verification flows treat failure as an edge case. It’s not. Depending on the method and user population, 10–30% of first attempts fail. The failure path determines whether those users retry or leave.
Effective failure handling includes: a clear explanation of why the attempt failed (not a generic “Verification failed” message), specific guidance on how to succeed on the next attempt (“Try again in better lighting” or “Make sure all four corners of your ID are visible”), and an option to switch to an alternative verification method rather than repeating the same one.
Measured impact: A well-designed failure path recovers 35–50% of users who fail on first attempt, compared to 15–20% recovery with a generic retry prompt.
6. Decouple Verification from Registration
The worst possible flow: force users to create an account, enter payment details, and then verify their age — with the risk that verification failure means they’ve wasted all that effort. The best possible flow: let users experience some value first (browse content, explore features), verify age when they hit an age-gated action, and only then prompt for account creation.
This isn’t always possible — some regulations require verification before any access. But where it is possible, decoupling verification from registration reduces total funnel abandonment by 20–30%.
7. Offer a “Verify Later” Option Where Regulation Allows
Some regulatory frameworks require verification before accessing specific content categories but not before accessing the platform itself. In these cases, allowing users to browse non-restricted content and verifying only when they attempt to access restricted material dramatically improves initial activation while maintaining compliance.
Measured impact: “Verify later” options increase overall platform activation by 25–40% while maintaining the same verification completion rate for age-gated content.
Measuring What Matters
You can’t optimize what you don’t measure. Here are the metrics that matter for age verification conversion, and the benchmarks you should target.
Verification initiation rate — the percentage of users who encounter a verification prompt and begin the process. Target: >85%. If you’re below 70%, your messaging or placement needs work.
Step-to-step completion rate — completion rate between each discrete step in your verification flow. Identify which step has the steepest drop and focus optimization there. No single step should have more than 20% drop-off.
First-attempt success rate — the percentage of users who complete verification on their first try. Target: >80%. Below 70% indicates a UX or guidance problem. Below 60% indicates a method mismatch for your user population.
Time to verification — the elapsed time from flow initiation to result. Target: under 10 seconds for age estimation, under 30 seconds for document verification. Measure p50 and p95, not just average.
Retry-to-success rate — among users who fail on the first attempt, what percentage eventually succeed. Target: >40%. Below 25% means your failure recovery path is broken.
Return user verification rate — how often returning users must re-verify. With reusable tokens, this should approach 0% for compliant returning users. Any re-verification of a previously verified user is pure friction.
The Compliance-Conversion Balance
Platform operators sometimes frame this as a trade-off: compliance versus conversion. It isn’t.
The platforms with the highest verification completion rates are also the most compliant. They’ve invested in the architecture — on-device processing, progressive assurance, reusable credentials — that regulators explicitly prefer because it minimizes data collection while maximizing effectiveness.
The platforms with the worst completion rates are the ones that bolted on the cheapest document-upload SDK they could find, pointed every user at the same flow regardless of context, and treated verification as a compliance checkbox rather than a product surface.
Age verification is now a permanent part of the internet’s infrastructure. The platforms that treat it as a core product experience — measured, optimized, and continuously improved — will outperform those that treat it as a tax on growth.
How Xident Approaches This Problem
Xident’s architecture was designed around the progressive assurance model from day one. On-device age estimation via WebAssembly delivers results in under 3 seconds with a 0.03% false positive rate. Token-based returning user verification eliminates re-verification friction entirely. And the SDK provides real-time camera guidance, automatic quality checks, and graceful escalation paths — all configurable through a single API.
The result is verification that satisfies Ofcom, eSafety, ARCOM, and KJM standards while maintaining completion rates above 90% across the full user funnel.
If you’re losing users at the verification step, the problem isn’t that verification exists — it’s how it’s implemented. Get started with Xident and see the difference architecture makes.